16 Internal structure of the PRS functionality
The PRS function can be divided into three main blocks that perform the required tasks to come up with the results. The three functional blocks are the following:
- Client: Assemble the
prs_tabletable if PGS Catalog is used, perform calls to the server to subset the resources and calculate the PRS with the subsetted resources. - Server resolver: Resolve the selected resources (VCF files) and subset them using the prs_table.
- Server analysis: Use the resolved resources (small VCF files with only the SNPs of interest according to the
prs_tabletable) to calculate the PRS.
In order to introduce a little how those three blocks work internally, schematized flow charts have been designed. To understand the exact inner working of the functionality it is advised to follow the flowcharts alongside the actual source code. Find the links to the three blocks source code, client, server resolver and server analysis.
16.1 Client
The client performs two basic tasks. The first one is to select between a user introduced prs_table or to retrieve the prs_table from the PGS Catalog. Please note that prs_table stands for Region Of Interest, which may not be the common term for PGS analysis but it makes sense since it refers to a table that contain the SNP’s of interest and their weight to the score. If the user introduces a custom prs_table and a PGS Catalog ID, only the introduced table will be used, discarding the PGS Catalog ID information. Once this table is assembled, the next step is to call the required functions on the study servers. First, the resource resolver is called, and after that, the function that calculates the PRS is called.
This is illustrated on the following figure.
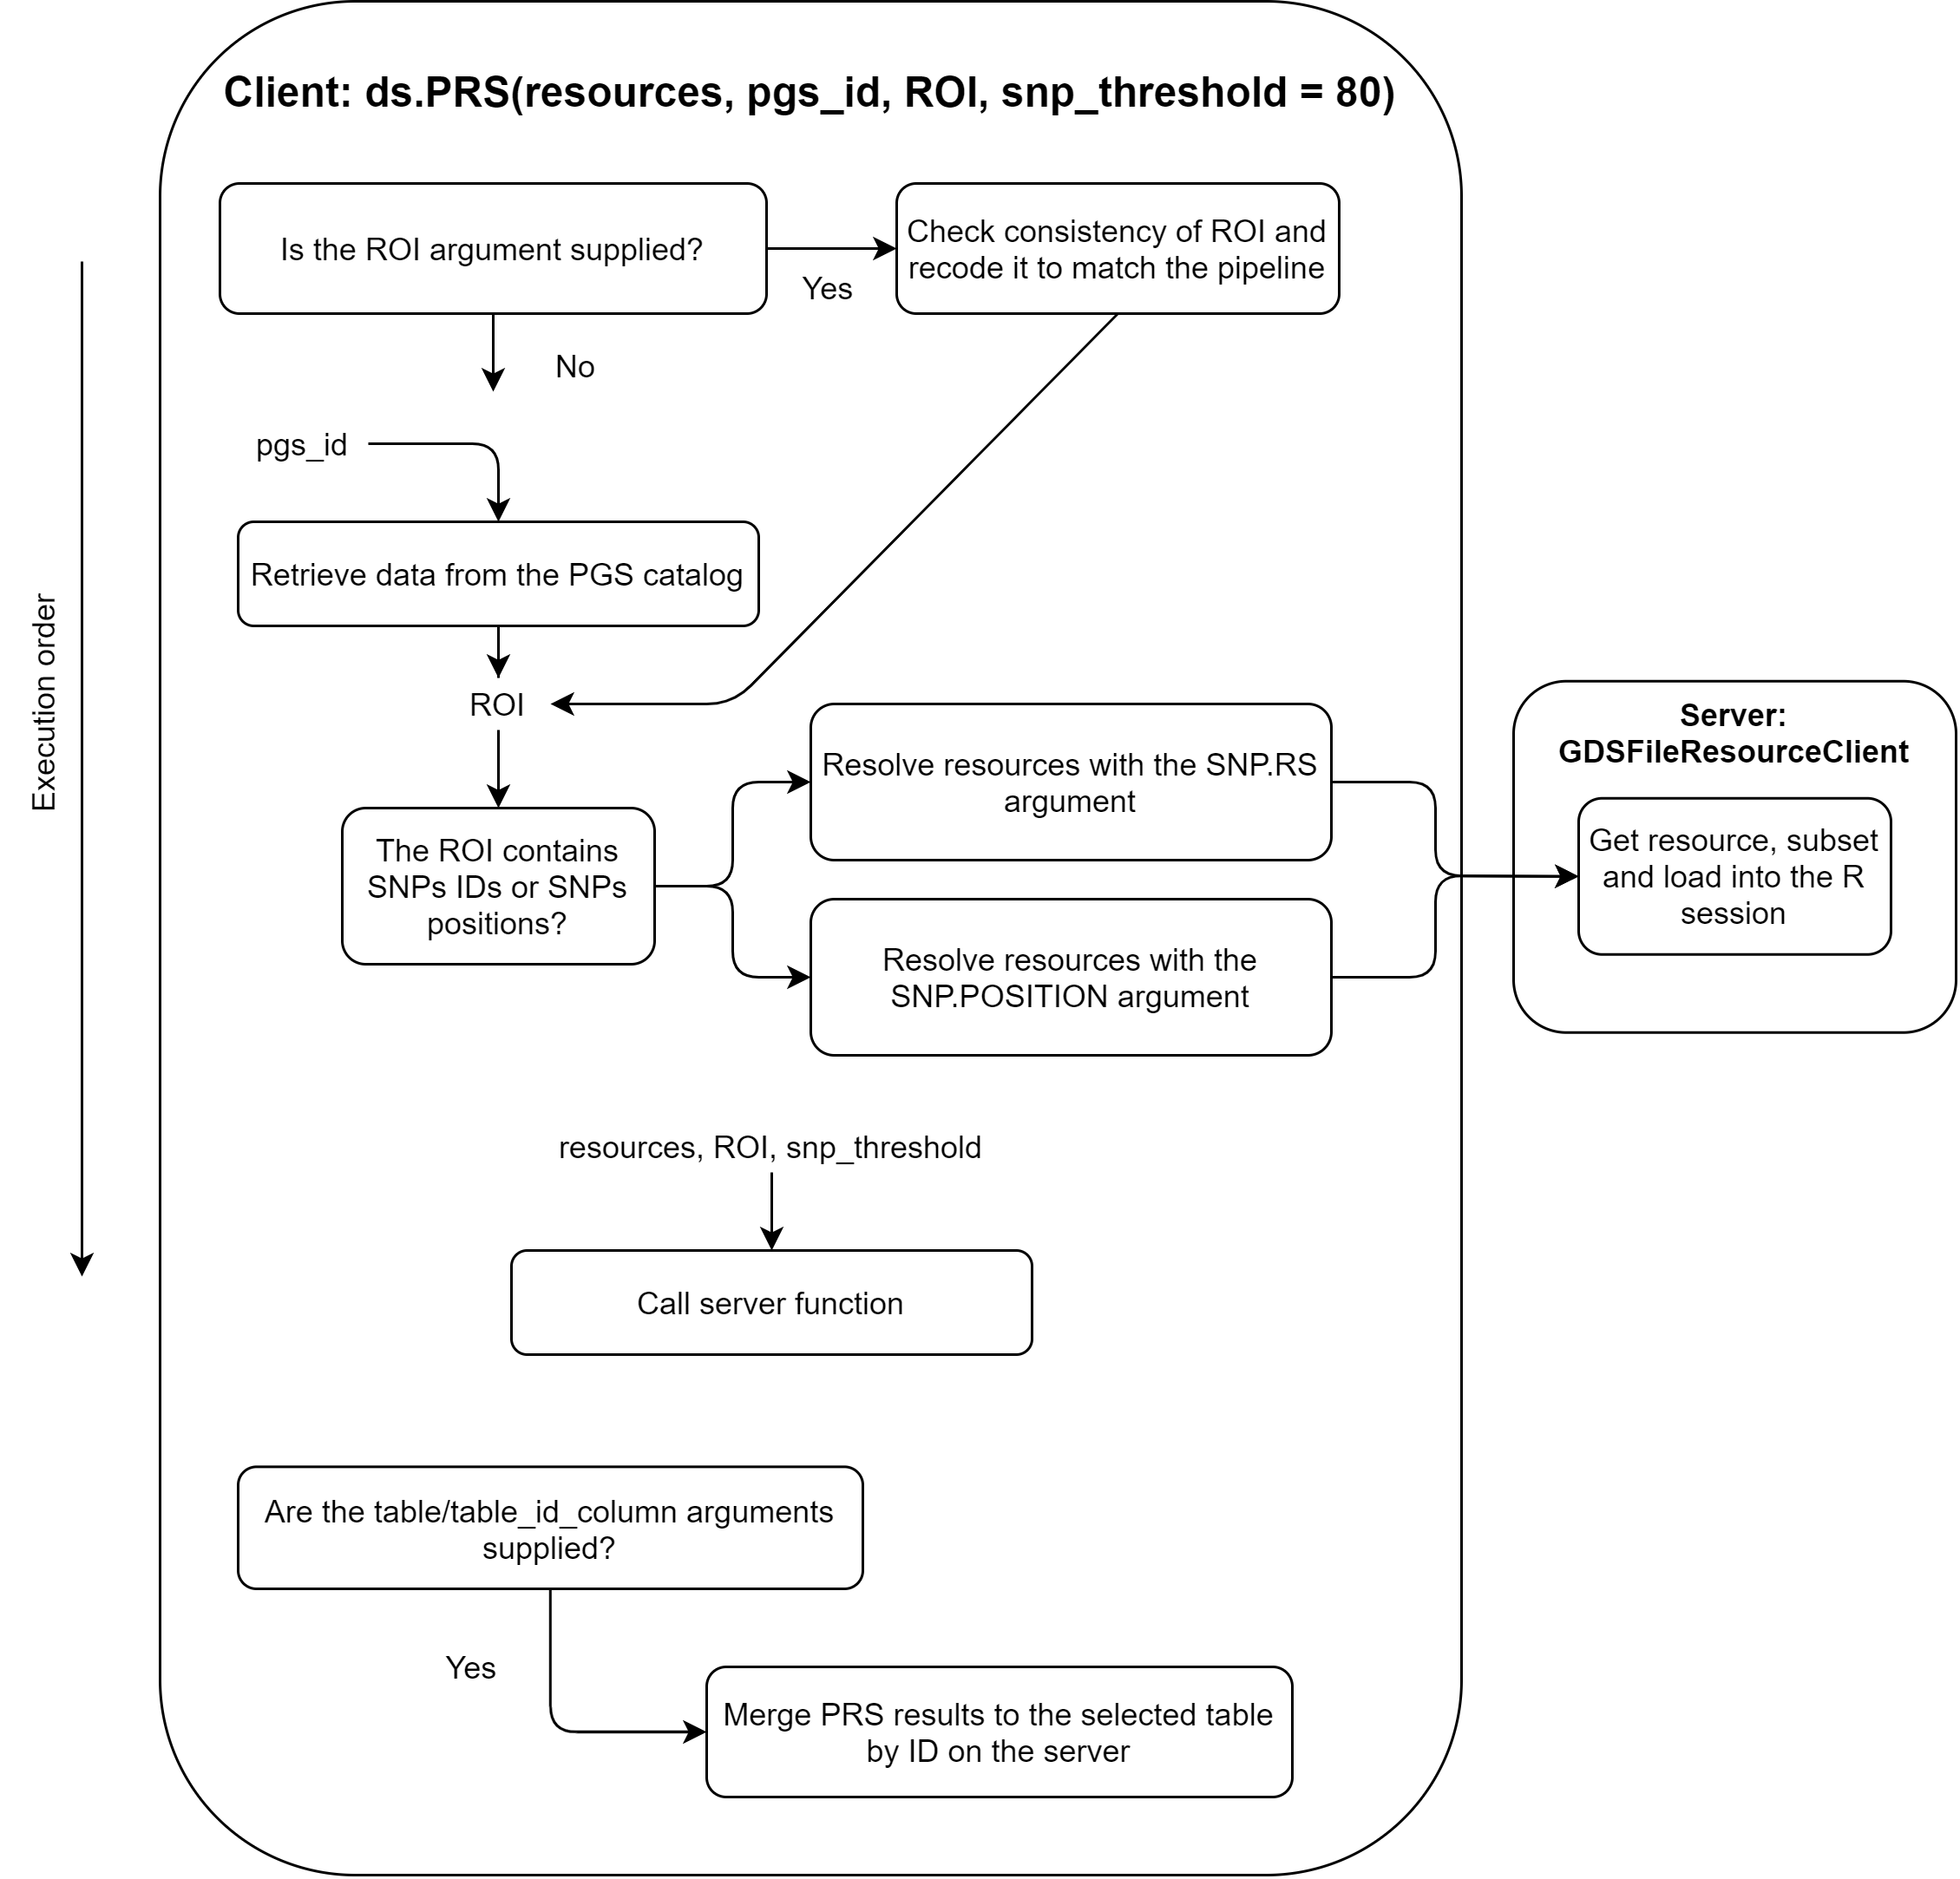
Figure 16.1: Flow chart of the client block.
16.2 Server resolver
The server resolver is in charge of resolving the resources. The interesting aspect is that only a region of interest is actually assigned to the R session, this is to avoid overloading the memory with unnecessary information. There are two different methodologies to perform this subsetting, one is using chromosome names and position and the other is using the SNP id’s. Due to the technical specification of VCF files, is much easier to perform the subsetting using chromosome names and positions because there is an indexing file for the VCF files to perform fast queries of regions by position. On the other hand, to filter a VCF file using SNP id’s, the whole file has to be scanned, yielding a much slower process.
This block is illustrated on the following figure.
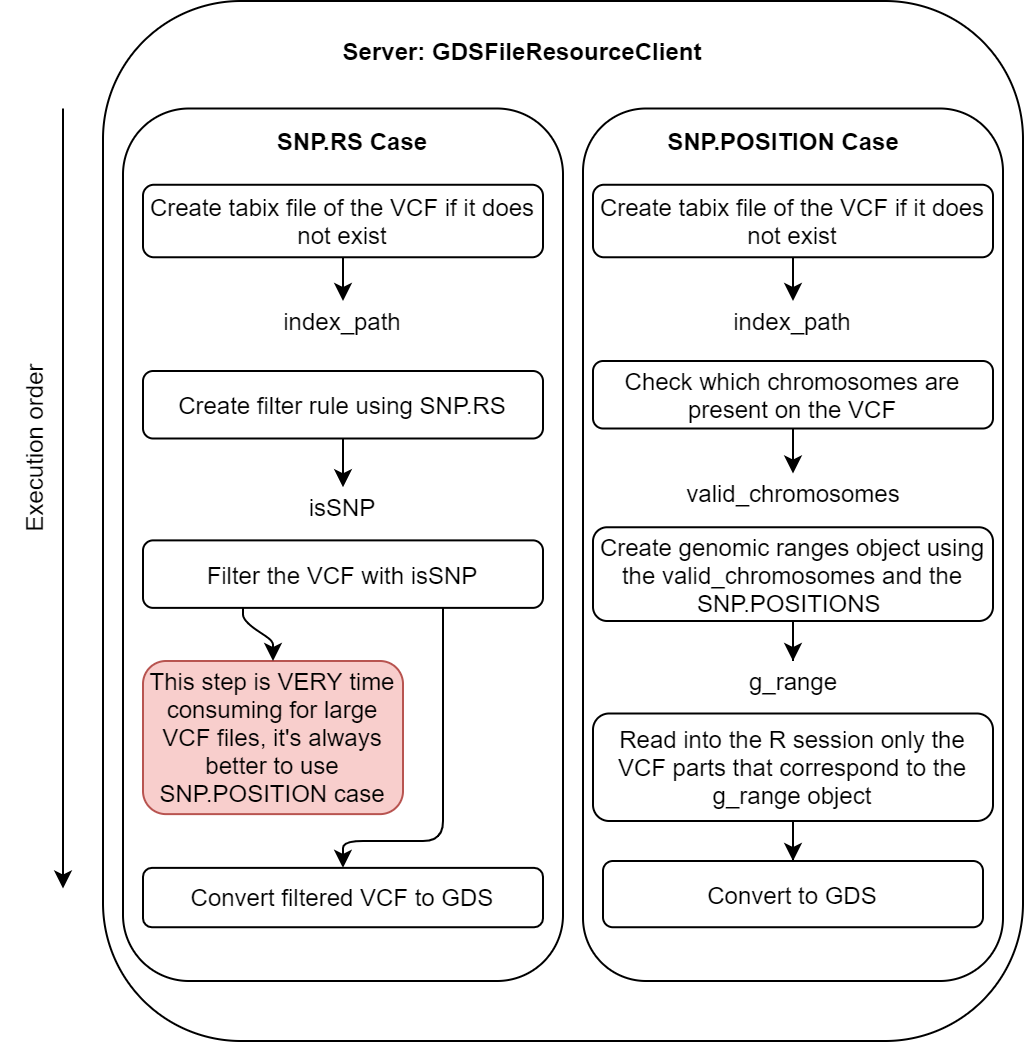
Figure 16.2: Flow chart of the server resolver block.
16.3 Server analysis
Many processes are performed inside the analysis block. For that reason, more than a flow chart, a step by step guide has been illustrated with the objects that are created (or modified) on each step. The most important step on this block is making sure that the alternate (risk) alleles match between the VCF resources and the alternate alleles stated by the prs_table or PGS Catalog.
The block is illustrated on the following figure.
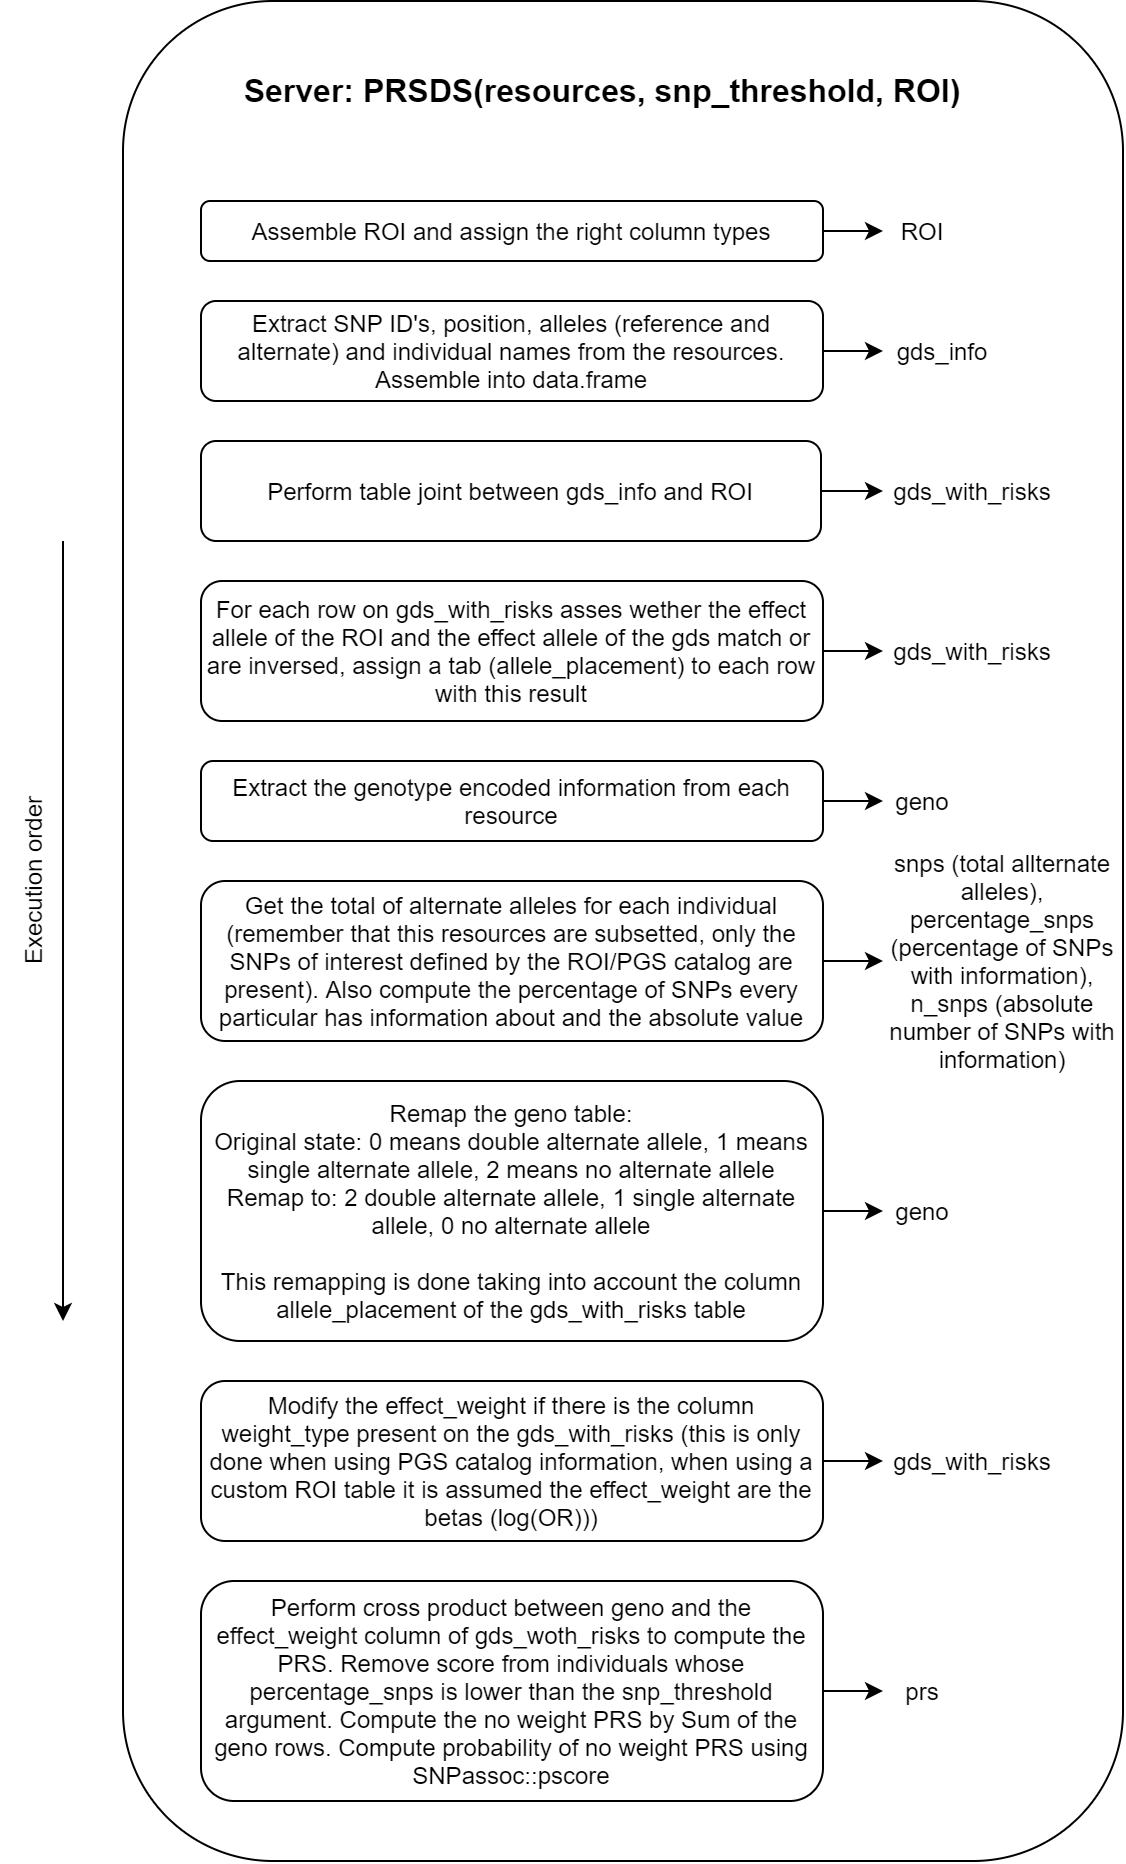
Figure 16.3: Flow chart of the server analysis block.