5 DataSHIELD
5.1 Introduction
Some research projects require pooling data from several studies to obtain sample sizes large and diverse enough for detecting interactions. Unfortunately, important ethico-legal constraints often prevent or impede the sharing of individual-level data across multiple studies. DataSHIELD aims to address this issue. DataSHIELD is a method that enables advanced statistical analysis of individual-level data from several sources without actually pooling the data from these sources together. DataSHIELD facilitates important research in settings where:
- a co-analysis of individual-level data from several studies is scientifically necessary but governance restrictions prevent the release or sharing of some of the required data, and/or render data access unacceptably slow,
- equivalent governance concerns prevent or hinder access to a single dataset,
- a research group wishes to actively share the information held in its data with others but does not wish to cede control of the governance of those data and/or the intellectual property they represent by physically handing over the data themselves,
- a dataset which is to be remotely analysed, or included in a multi-study co-analysis, contains data objects (e.g. images) which are too large to be physically transferred to the analysis location.
A typical DataSHIELD infrastructure (see Figure 5.1) is composed of one analysis node (the DataSHIELD client) connected to one or several data analysis nodes (the DataSHIELD servers). In each of these server nodes, there is an R server application which can only be accessed through a DataSHIELD-compliant middleware application. This middleware application acts as a broker for managing R server sessions in a multi-user environment, assigning data and launching analysis on the R server. The analysis execution environment is then fully controlled: users must be authenticated, must have the proper permissions to access the data of interest and can only perform some predefined assignment and aggregation operations. Importantly, the operations that are permitted are designed to prevent the user having access to individual data items while still allowing useful work to be done with the data. For example, users can fit a generalised linear model to a dataset and receive information about the model coefficients, but are not given the residuals, as these could be used to reconstruct the original data.The reference implementation of this DataSHIELD infrastructure is based on the Opal data repository.
Figure 5.1: Typical DataSHIELD infrastructure, including one central analysis node (client) and several data nodes (servers).
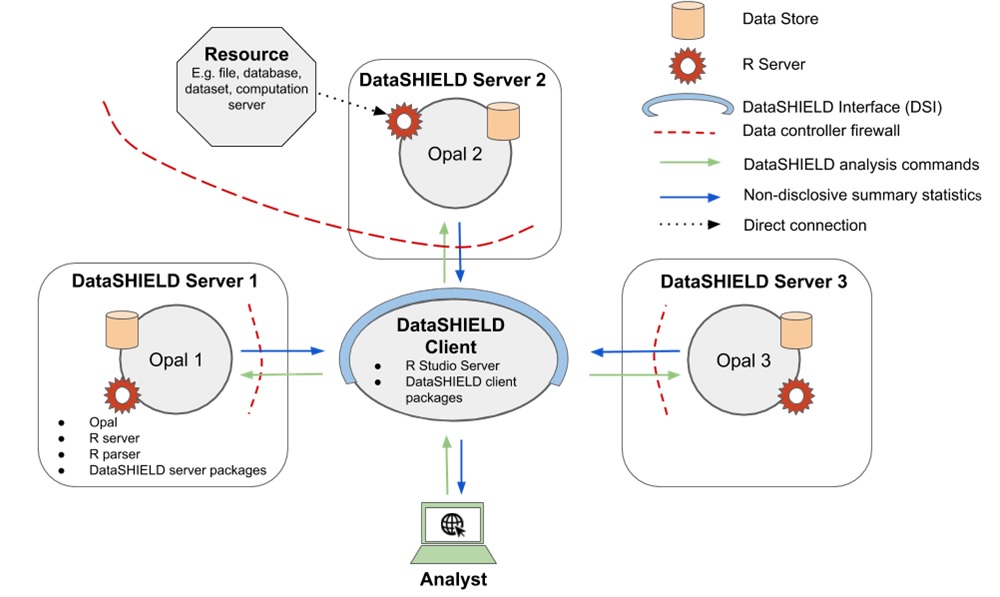
The client node interacts programmatically in R with the server nodes using the DataSHIELD Interface implemented as the DSI R package. The DSI defines prototype functions to authenticate the user and to perform assignment and aggregation operations in each of the R servers sitting in the server nodes. The reference implementation of DSI is the DSOpal R package. An alternate implementation of DSI is DSLite, an R package targetted at DataSHIELD developers by offering a lightweight, pure R implementation of the whole DataSHIELD infrastructure.
5.2 DataSHIELD R Interface (DSI)
The DataSHIELD Interface (DSI) defines a set of S4 classes and generic methods that can be implemented for accessing a data repository supporting the DataSHIELD infrastructure: controlled R commands to be executed on the server side that ensure only non disclosive information is returned to client side.
5.2.1 Class Structures
The DSI S4 classes are:
| Class | Description |
|---|---|
DSObject |
A common base class for all DSI, |
DSDriver |
A class to drive the creation of a connection object, |
DSConnection |
Allows the interaction with the remote server; DataSHIELD operations such as aggregation and assignment return a result object; DataSHIELD setup status check can be performed (dataset access, configuration comparision), |
DSResult |
Wraps access to the result, which can be fetched either synchronously or asynchronously depending on the capabilities of the data repository server. |
All classes are virtual: they cannot be instantiated directly and instead must be subclassed. See DSOpal for a reference implementation of DSI based on the Opal data repository.
These S4 classes and generic methods are meant to be used for implementing connections to a DataSHIELD-aware data repository.
5.2.2 Higher Level Functions
In addition to these S4 classes, DSI provides functions to handle a list of remote data repository servers:
| Functions | Description |
|---|---|
datashield.login |
Create DSConnection objects for the data repositories, using the DSDriver specification. |
datashield.logout |
Destroy the DSConnections objects. |
datashield.aggregate, datashield.assign |
Typical DataSHIELD operations on DSConnection objects; results can be fetched through DSResult objects. |
datashield.connections, datashield.connections_default, datashield.connections_find |
Management of the list of DSConnection objects that can be discovered and used by the client-side analytic functions. |
datashield.workspaces, datashield.workspace_save, datashield.workspace_rm |
Manage R images of the remote DataSHIELD sessions (to speed up restoration of data analysis sessions). |
datashield.symbols, datashield.symbol_rm |
Minimalistic management of the R symbols living in the remote DataSHIELD sessions. |
datashield.tables, datashield.table_status |
List the tables and their accessibility across a set of data repositories. |
datashield.resources, datashield.resource_status |
List the resources and their accessibility across a set of data repositories. |
datashield.pkg_status, datashield.method_status, datashield.methods |
Utility functions to explore the DataSHIELD setup across a set of data repositories. |
These datashield.* functions are meant to be used by DataSHIELD packages developers and users.
5.2.3 Options
Some options can be set to modify the behavior of the DSI:
| Option | Description |
|---|---|
datashield.env |
The R environment in which the DSConnection object list is to be looked for. Default value is the Global Environment: globalenv(). |
datashield.progress |
A logical to enable visibility of progress bars. Default value is TRUE. |
datashield.progress.clear |
A logical to make the progress bar disappear after it has been completed. Default value is FALSE. |
datashield.error.stop |
A logical to alter error handling behavior: if TRUE an error is raised when at least one server has failed, otherwise a warning message is issued. Default value is TRUE. |
5.3 DataSHIELD/Opal Implementation
Opal is a web application that is accessible through web services. It implements DataSHIELD methods thanks to the following built-in features:
- integration with an R server, where the DataSHIELD operations will take place,
- secure data management, with fine-grained permissions (to restrict access to individual level data),
- web services API, that allows Opal operations to be run from an R script.
In addition to these features, Opal manages the DataSHIELD configuration which consists of declaring the set of permitted aggregation/assignment R functions and some R options.
5.3.1 Client
The opalr R package is a general purpose Opal connection R library (authentication is required) that is used to perform various operations (authorization may be required). The DSOpal R package is an implementation of the DSI, built on top of opalr. All the DataSHIELD operations are transparently applied to one or more Opal server using the DSI higher-level functions. Opal also supports asynchronous function calls (submission of a R operation, then later retrieval of the result) which allows operations on several DataSHIELD analysis nodes in parallel.
5.3.2 Server
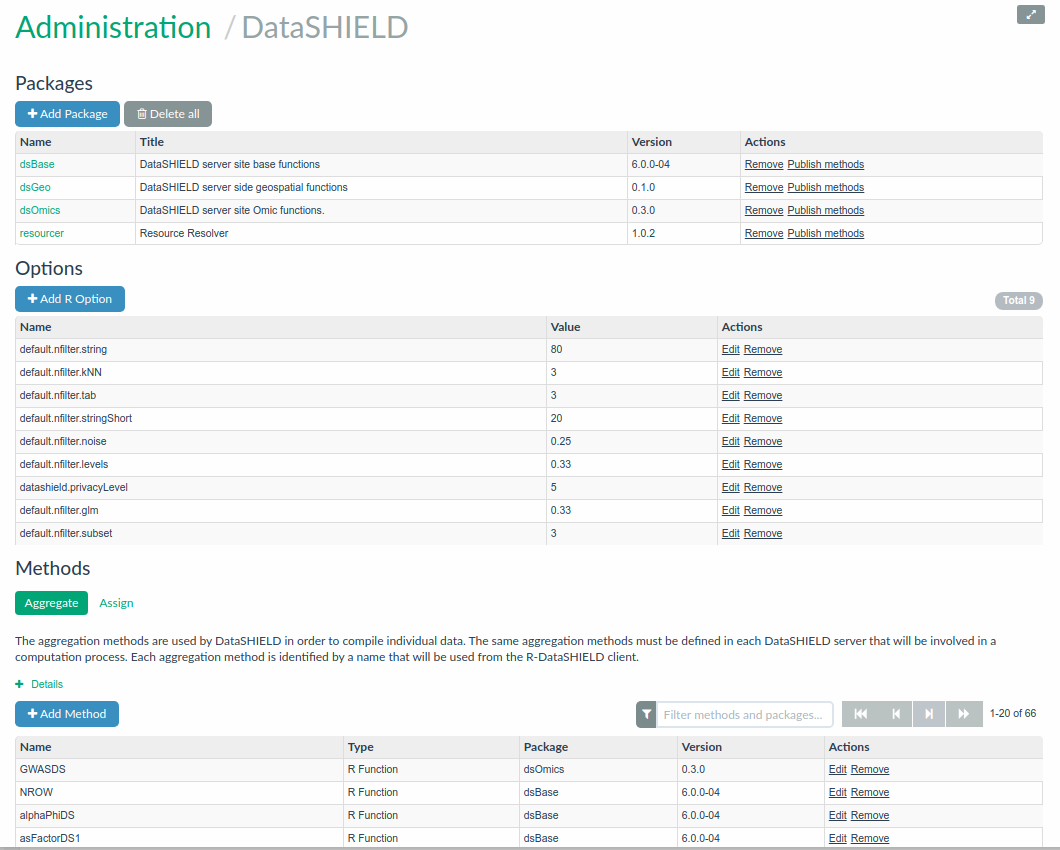
On the R server managed by Opal, some DataSHIELD-compliant R packages can be managed using the Opal’s web interface: installation, removal of DataSHIELD-compliant R packages and automatic DataSHIELD configuration discovery. Opal guarantees that only the allowed functions can be called. The DataSHIELD-compliant R package guarantees that only aggregated results are returned to the client. The term ‘aggregated’ here means that the data in the R server will go through a function that summarizes individual-level data into a non-disclosive form. For example, obtaining the length of a vector, or obtaining the summary statistics of a vector (min, max, mean, etc.).
These DataSHIELD functions are customisable. That is, administrators of the Opal server can add, remove, modify or create completely custom aggregating methods that are proposed to DataSHIELD clients.
Figure 5.2: DataSHIELD configuration in Opal
When performing a DataSHIELD analysis session, a typical workflow on a single Opal analysis node is the following:
- authentication of the user (requires authorization to use DataSHIELD service),
- creation and initialization of an R server session,
- assignment of Opal-managed data into the R server session (requires data access authorization),
- processing incoming R operation requests (aggregation and assignment function calls requires authorization) that are forwarded to the R server session; non-disclosive aggregated result is then returned to the R client.
5.4 Demo
Readers can read the DataSHIELD page in Opal documentation to have a global overview about how to use DataSHIELD functions. It describes how to perform basic statistical analyses, linear and generalized linear models and some data visualization. A complete description of how DataSHIELD works, with lots of materials, examples, courses and real data analyses can be obtained in the DataSHIELD Wiki.
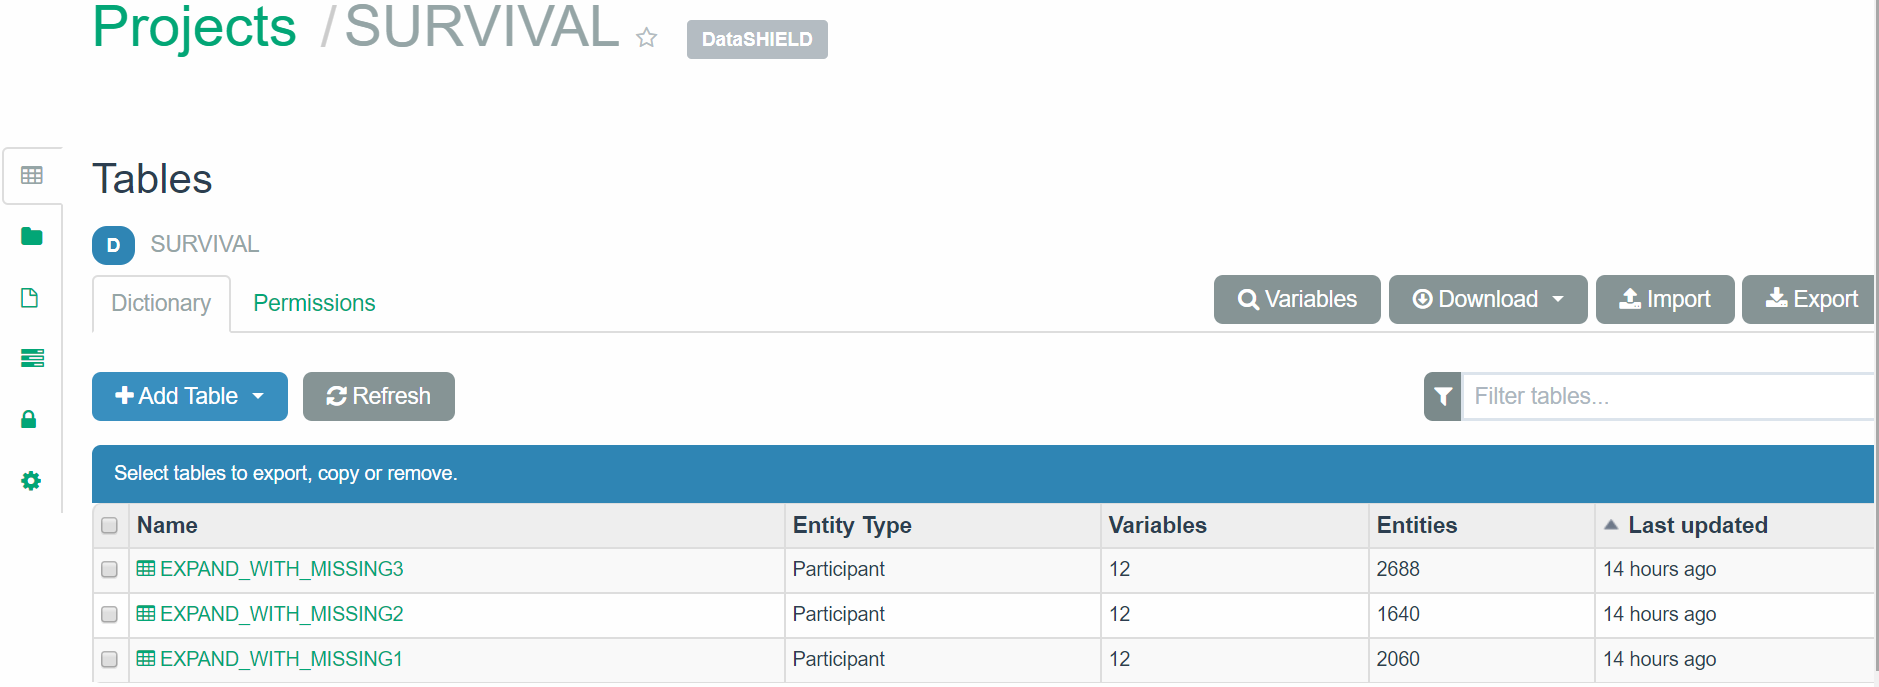
The following is a simple illustration of how to analyze some data available in the Opal demo site. The Projects page gives access to the different projects avaialble in this Opal server. If we select the SURVIVAL project we see that there are three tables:
Figure 5.3: Tables available in the SURVIVAL project from our Opal example (https://opal-demo.obiba.org/)
First we build a connection object with user credentials and the location of the server for each of the study:
library(DSOpal)
builder <- newDSLoginBuilder()
builder$append(server = "study1", url = "https://opal-demo.obiba.org",
               user = "dsuser", password = "password")
builder$append(server = "study2", url = "https://opal-demo.obiba.org",
               user = "dsuser", password = "password")
builder$append(server = "study3", url = "https://opal-demo.obiba.org",
               user = "dsuser", password = "password")
logindata <- builder$build()
logindata
server url table resource driver user password token options
1 study1 https://opal-demo.obiba.org OpalDriver dsuser password
2 study2 https://opal-demo.obiba.org OpalDriver dsuser password
3 study3 https://opal-demo.obiba.org OpalDriver dsuser password Then we perform login into each of the analysis servers and assign for each of them a different table with the same R symbol name:
conns <- datashield.login(logindata)
datashield.assign.table(conns, symbol = "D",
                        table = list(study1 = "SURVIVAL.EXPAND_WITH_MISSING1",
                                     study2 = "SURVIVAL.EXPAND_WITH_MISSING2",
                                     study3 = "SURVIVAL.EXPAND_WITH_MISSING3"))
datashield.symbols(conns)
$study1
[1] "D"
$study2
[1] "D"
$study3
[1] "D"Then we use the DataSHIELD functions from the dsBaseClient package to analyse the data and get non-disclosive summary statistics. The package should be first loaded
Then, for example, we can get the column names and the dimension of the dataset from each study:
$study1
 [1] "id"        "study.id"  "time.id"   "starttime" "endtime"   "survtime"  "cens"      "age.60"
 [9] "female"    "noise.56"  "pm10.16"   "bmi.26"

$study2
 [1] "id"        "study.id"  "time.id"   "starttime" "endtime"   "survtime"  "cens"      "age.60"
 [9] "female"    "noise.56"  "pm10.16"   "bmi.26"

$study3
 [1] "id"        "study.id"  "time.id"   "starttime" "endtime"   "survtime"  "cens"      "age.60"
 [9] "female"    "noise.56"  "pm10.16"   "bmi.26"
we can get the dimension of the datasetes:
$`dimensions of D in study1`
[1] 2060   12

$`dimensions of D in study2`
[1] 1640   12

$`dimensions of D in study3`
[1] 2688   12

$`dimensions of D in combined studies`
[1] 6388   12
the summary of a variable which includes its class, length, quantiles and mean:
$study1
$study1$class
[1] "numeric"

$study1$length
[1] 2060

$study1$`quantiles & mean`
        5%        10%        25%        50%        75%        90%        95%       Mean
-27.000000 -21.000000 -13.000000  -3.000000   7.000000  15.000000  20.000000  -3.167883


$study2
$study2$class
[1] "numeric"

$study2$length
[1] 1640

$study2$`quantiles & mean`
        5%        10%        25%        50%        75%        90%        95%       Mean
-27.000000 -22.000000 -15.000000  -4.000000   7.000000  14.000000  20.000000  -4.008637


$study3
$study3$class
[1] "numeric"

$study3$length
[1] 2688

$study3$`quantiles & mean`
        5%        10%        25%        50%        75%        90%        95%       Mean
-25.700000 -21.000000 -13.000000  -3.000000   7.000000  14.000000  20.000000  -3.089989
we can get contigency table between categorical variables:
 Data in all studies were valid

Study 1 :  No errors reported from this study
Study 2 :  No errors reported from this study
Study 3 :  No errors reported from this study
$output.list
$output.list$TABLE.STUDY.1_row.props
D$cens
D$female 0 1 NA
0 0.726 0.261 0.01280
1 0.833 0.158 0.00901
NA 0.750 0.250 0.00000
$output.list$TABLE.STUDY.1_col.props
D$cens
D$female 0 1 NA
0 0.42000 0.57700 0.545
1 0.57300 0.41400 0.455
NA 0.00743 0.00946 0.000
$output.list$TABLE.STUDY.2_row.props
D$cens
D$female 0 1 NA
0 0.759 0.239 0.00286
1 0.860 0.139 0.00107
NA 0.800 0.200 0.00000
$output.list$TABLE.STUDY.2_col.props
D$cens
D$female 0 1 NA
0 0.39700 0.56000 0.667
1 0.60000 0.43600 0.333
NA 0.00299 0.00336 0.000
$output.list$TABLE.STUDY.3_row.props
D$cens
D$female 0 1 NA
0 0.714 0.274 0.01190
1 0.828 0.164 0.00802
NA 0.706 0.294 0.00000
$output.list$TABLE.STUDY.3_col.props
D$cens
D$female 0 1 NA
0 0.40100 0.56300 0.538
1 0.59300 0.42800 0.462
NA 0.00574 0.00874 0.000
$output.list$TABLES.COMBINED_all.sources_row.props
D$cens
D$female 0 1 NA
0 0.729 0.261 0.00997
1 0.838 0.155 0.00650
NA 0.737 0.263 0.00000
$output.list$TABLES.COMBINED_all.sources_col.props
D$cens
D$female 0 1 NA
0 0.40600 0.56700 0.549
1 0.58800 0.42500 0.451
NA 0.00555 0.00773 0.000
$output.list$TABLE_STUDY.1_counts
D$cens
D$female 0 1 NA
0 678 244 12
1 925 175 10
NA 12 4 0
$output.list$TABLE_STUDY.2_counts
D$cens
D$female 0 1 NA
0 531 167 2
1 804 130 1
NA 4 1 0
$output.list$TABLE_STUDY.3_counts
D$cens
D$female 0 1 NA
0 839 322 14
1 1239 245 12
NA 12 5 0
$output.list$TABLES.COMBINED_all.sources_counts
D$cens
D$female 0 1 NA
0 2048 733 28
1 2968 550 23
NA 28 10 0
$validity.message
[1] "Data in all studies were valid"or we can fit a generalized linear model among many other analyses:
$Nvalid
[1] 6169

$Nmissing
[1] 219

$Ntotal
[1] 6388

$disclosure.risk
       RISK OF DISCLOSURE
study1                  0
study2                  0
study3                  0

$errorMessage
       ERROR MESSAGES
study1 "No errors"
study2 "No errors"
study3 "No errors"

$nsubs
[1] 6169

$iter
[1] 6

$family

Family: binomial
Link function: logit


$formula
[1] "cens ~ female + bmi.26 + pm10.16"

$coefficients
              Estimate  Std. Error   z-value      p-value low0.95CI.LP high0.95CI.LP      P_OR low0.95CI.P_OR
(Intercept) -0.9465551 0.046427292 -20.38790 2.141278e-92   -1.0375510    -0.8555593 0.2795781      0.2616228
female1     -0.7240154 0.067603806 -10.70968 9.167462e-27   -0.8565164    -0.5915143 0.4848017      0.4246388
bmi.26       0.1239566 0.007308207  16.96129 1.588245e-64    0.1096328     0.1382804 1.1319667      1.1158682
pm10.16      0.6620624 0.037059614  17.86479 2.217477e-71    0.5894269     0.7346979 1.9387867      1.8029548
            high0.95CI.P_OR
(Intercept)       0.2982680
female1           0.5534885
bmi.26            1.1482975
pm10.16           2.0848521

$dev
[1] 5544.853

$df
[1] 6165

$output.information
[1] "SEE TOP OF OUTPUT FOR INFORMATION ON MISSING DATA AND ERROR MESSAGES"
For a full list of the dsBaseClient functions you can use the following command:
### Full search path
 [1] ".GlobalEnv"                                "package:dsBaseClient"
 [3] "package:airway"                            "package:SummarizedExperiment"
 [5] "package:DelayedArray"                      "package:matrixStats"
 [7] "package:Homo.sapiens"                      "package:TxDb.Hsapiens.UCSC.hg19.knownGene"
 [9] "package:org.Hs.eg.db"                      "package:GO.db"
[11] "package:OrganismDbi"                       "package:GenomicFeatures"
[13] "package:AnnotationDbi"                     "package:tweeDEseqCountData"
[15] "package:forcats"                           "package:stringr"
[17] "package:dplyr"                             "package:purrr"
[19] "package:readr"                             "package:tidyr"
[21] "package:tibble"                            "package:ggplot2"
[23] "package:tidyverse"                         "package:kableExtra"
[25] "package:BiocStyle"                         "package:GenomicRanges"
[27] "package:GenomeInfoDb"                      "package:IRanges"
[29] "package:S4Vectors"                         "package:stats4"
[31] "package:snpStats"                          "package:Matrix"
[33] "package:survival"                          "package:Biobase"
[35] "package:BiocGenerics"                      "package:parallel"
[37] "package:DSOpal"                            "package:DSI"
[39] "package:R6"                                "package:progress"
[41] "package:opalr"                             "package:httr"
[43] "tools:rstudio"                             "package:stats"
[45] "package:graphics"                          "package:grDevices"
[47] "package:utils"                             "package:datasets"
[49] "package:methods"                           "Autoloads"
[51] "package:base"

### userDefinedClient functions
[1] "No clientside functions in this repository"

### dsBaseClient functions
 [1] "ds.asCharacter"             "ds.asDataMatrix"            "ds.asFactor"
 [4] "ds.asInteger"               "ds.asList"                  "ds.asLogical"
 [7] "ds.asMatrix"                "ds.asNumeric"               "ds.assign"
[10] "ds.Boole"                   "ds.c"                       "ds.cbind"
[13] "ds.changeRefGroup"          "ds.class"                   "ds.colnames"
[16] "ds.completeCases"           "ds.contourPlot"             "ds.cor"
[19] "ds.corTest"                 "ds.cov"                     "ds.dataFrame"
[22] "ds.dataFrameFill"           "ds.dataFrameSort"           "ds.dataFrameSubset"
[25] "ds.densityGrid"             "ds.dim"                     "ds.exists"
[28] "ds.exp"                     "ds.glm"                     "ds.glmerSLMA"
[31] "ds.glmSLMA"                 "ds.heatmapPlot"             "ds.histogram"
[34] "ds.isNA"                    "ds.isValid"                 "ds.length"
[37] "ds.levels"                  "ds.lexis"                   "ds.list"
[40] "ds.listClientsideFunctions" "ds.listDisclosureSettings"  "ds.listOpals"
[43] "ds.listServersideFunctions" "ds.lmerSLMA"                "ds.log"
[46] "ds.look"                    "ds.ls"                      "ds.make"
[49] "ds.matrix"                  "ds.matrixDet"               "ds.matrixDet.report"
[52] "ds.matrixDiag"              "ds.matrixDimnames"          "ds.matrixInvert"
[55] "ds.matrixMult"              "ds.matrixTranspose"         "ds.mean"
[58] "ds.meanByClass"             "ds.meanSdGp"                "ds.merge"
[61] "ds.message"                 "ds.names"                   "ds.numNA"
[64] "ds.quantileMean"            "ds.rbind"                   "ds.rBinom"
[67] "ds.recodeLevels"            "ds.recodeValues"            "ds.rep"
[70] "ds.replaceNA"               "ds.reShape"                 "ds.rm"
[73] "ds.rNorm"                   "ds.rowColCalc"              "ds.rPois"
[76] "ds.rUnif"                   "ds.sample"                  "ds.scatterPlot"
[79] "ds.seq"                     "ds.setDefaultOpals"         "ds.setSeed"
[82] "ds.subset"                  "ds.subsetByClass"           "ds.summary"
[85] "ds.table"                   "ds.table1D"                 "ds.table2D"
[88] "ds.tapply"                  "ds.tapply.assign"           "ds.testObjExists"
[91] "ds.unList"                  "ds.var"                     "ds.vectorCalc"

If you cannot see one or more of the clientside functions you expected to find please see above for the full search path. If one of the paths is a possible clientside repository issue the R command ls(pos='package:dsPackageName') where 'package:dsPackageName' is the full name stated in the search path
[1] "No clientside functions in this repository" "ds.asCharacter"
[3] "ds.asDataMatrix" "ds.asFactor"
[5] "ds.asInteger" "ds.asList"
[7] "ds.asLogical" "ds.asMatrix"
[9] "ds.asNumeric" "ds.assign"
[11] "ds.Boole" "ds.c"
[13] "ds.cbind" "ds.changeRefGroup"
[15] "ds.class" "ds.colnames"
[17] "ds.completeCases" "ds.contourPlot"
[19] "ds.cor" "ds.corTest"
[21] "ds.cov" "ds.dataFrame"
[23] "ds.dataFrameFill" "ds.dataFrameSort"
[25] "ds.dataFrameSubset" "ds.densityGrid"
[27] "ds.dim" "ds.exists"
[29] "ds.exp" "ds.glm"
[31] "ds.glmerSLMA" "ds.glmSLMA"
[33] "ds.heatmapPlot" "ds.histogram"
[35] "ds.isNA" "ds.isValid"
[37] "ds.length" "ds.levels"
[39] "ds.lexis" "ds.list"
[41] "ds.listClientsideFunctions" "ds.listDisclosureSettings"
[43] "ds.listOpals" "ds.listServersideFunctions"
[45] "ds.lmerSLMA" "ds.log"
[47] "ds.look" "ds.ls"
[49] "ds.make" "ds.matrix"
[51] "ds.matrixDet" "ds.matrixDet.report"
[53] "ds.matrixDiag" "ds.matrixDimnames"
[55] "ds.matrixInvert" "ds.matrixMult"
[57] "ds.matrixTranspose" "ds.mean"
[59] "ds.meanByClass" "ds.meanSdGp"
[61] "ds.merge" "ds.message"
[63] "ds.names" "ds.numNA"
[65] "ds.quantileMean" "ds.rbind"
[67] "ds.rBinom" "ds.recodeLevels"
[69] "ds.recodeValues" "ds.rep"
[71] "ds.replaceNA" "ds.reShape"
[73] "ds.rm" "ds.rNorm"
[75] "ds.rowColCalc" "ds.rPois"
[77] "ds.rUnif" "ds.sample"
[79] "ds.scatterPlot" "ds.seq"
[81] "ds.setDefaultOpals" "ds.setSeed"
[83] "ds.subset" "ds.subsetByClass"
[85] "ds.summary" "ds.table"
[87] "ds.table1D" "ds.table2D"
[89] "ds.tapply" "ds.tapply.assign"
[91] "ds.testObjExists" "ds.unList"
[93] "ds.var" "ds.vectorCalc" Finaly we clean up the R server sessions: