13 Omic data analysis: types of implemented analyses
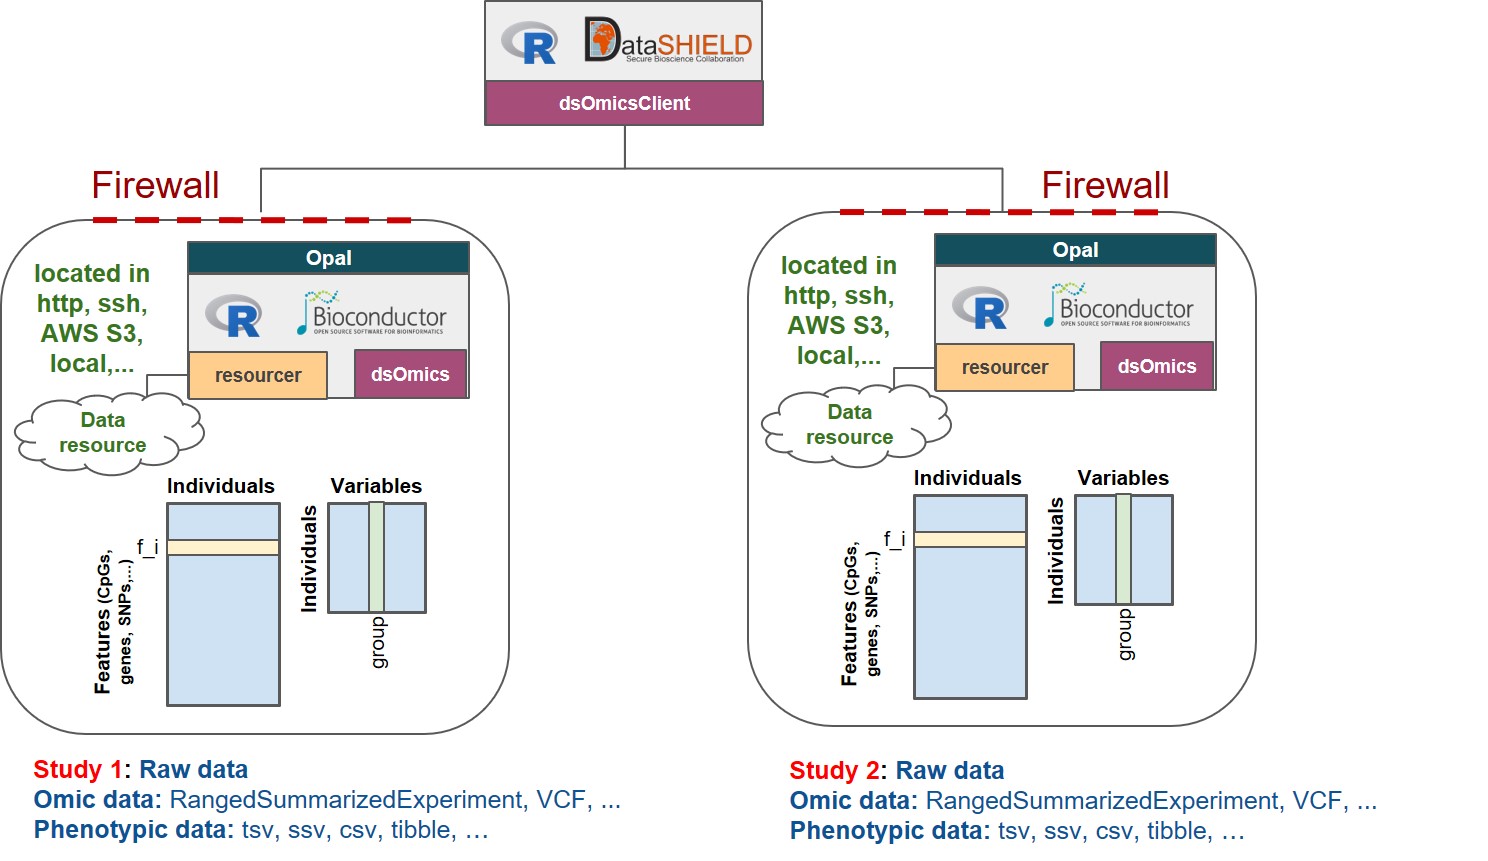
The Figure 13.1 describes the different types of ’omic association analyses that can be performed using DataSHIELD client functions implemented in the dsOmicsClient package. Basically, data (’omic and phenotypes/covariates) can be stored in different sites (http, ssh, AWS S3, local, …) and are managed with Opal through the resourcer package and their extensions implemented in dsOmics.
Figure 13.1: Non-disclosive omic data analysis with DataSHIELD and Bioconductor. The figure illustrates how the resourcer package is used to get access to omic data through the Opal servers. Then DataSHIELD is used in the client side to perform non-disclosive data analyses.
Then, dsOmicsClient package allows different types of analyses: pooled and meta-analysis. Both methods are based on fitting different Generalized Linear Models (GLMs) for each feature when assesing association between ’omic data and the phenotype/trait/condition of interest. Of course, non-disclosive ’omic data analysis from a single study can also be performed.
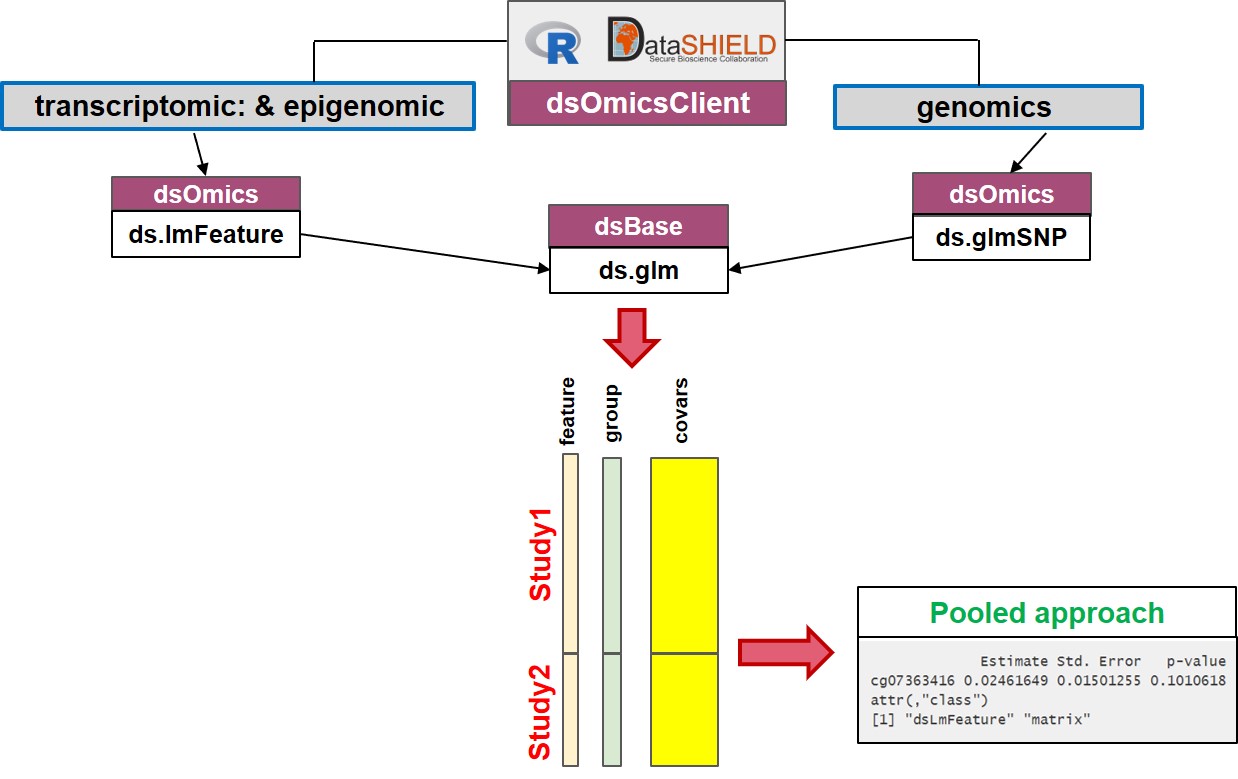
The pooled approach (Figure 13.2) is recommended when the user wants to analyze ’omic data from different sources and obtain results as if the data were located in a single computer. It should be noted that this can be very time consuming when analyzing multiple features since it calls a base function in DataSHIELD (ds.glm) repeatedly. It also cannot be recommended when data are not properly harmonized (e.g. gene expression normalized using different methods, GWAS data having different platforms, …). Furthermore when it is necesary to remove unwanted variability (for transcriptomic and epigenomica analysis) or control for population stratification (for GWAS analysis), this approach cannot be used since we need to develop methods to compute surrogate variables (to remove unwanted variability) or PCAs (to to address population stratification) in a non-disclosive way.
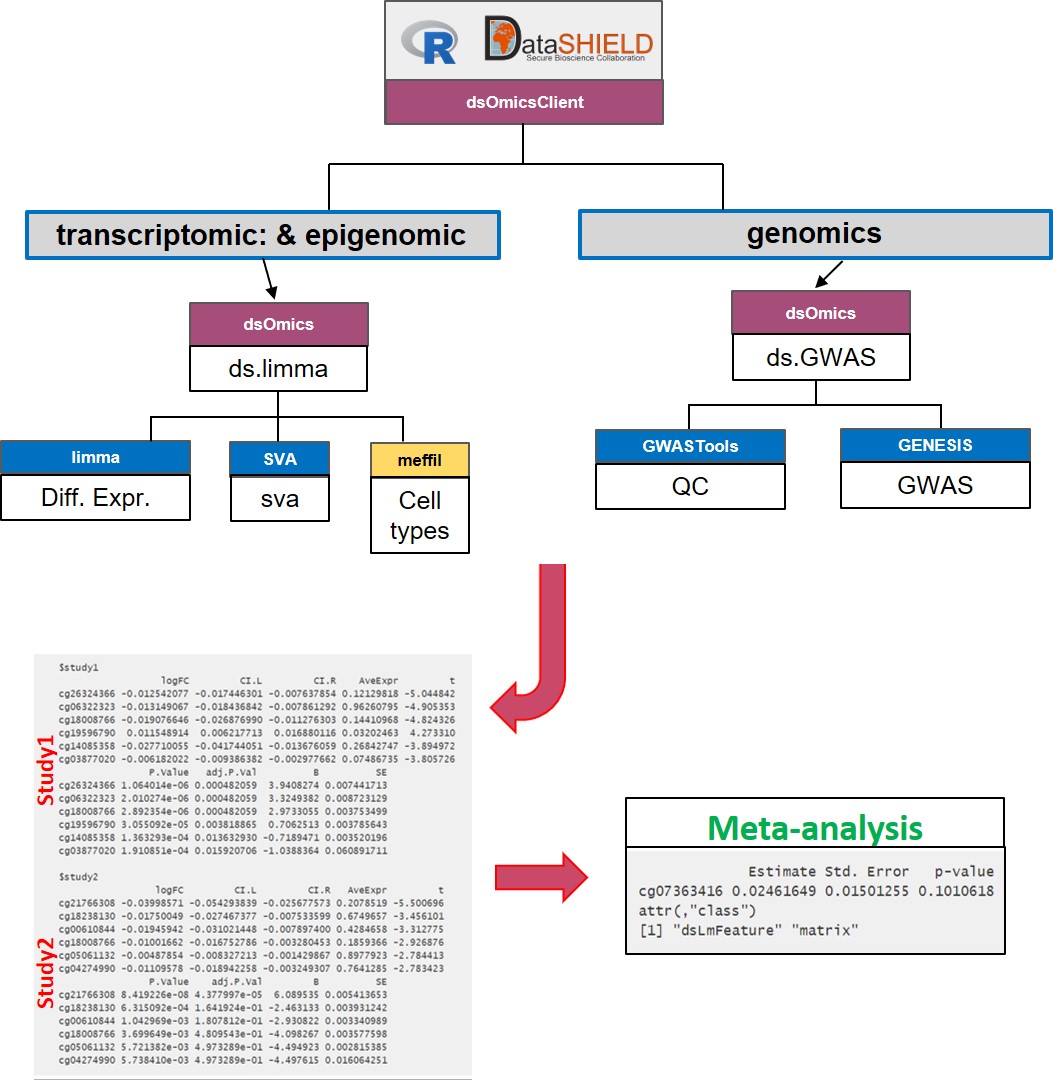
The meta-analysis approach Figure 13.3 overcomes the limitations raised when performing pooled analyses. First, the computation issue is addressed by using scalable and fast methods to perform data analysis at whole-genome level at each location The transcriptomic and epigenomic data analyses make use of the widely used limma package that uses ExpressionSet or RangedSummarizedExperiment Bioc infrastructures to deal with ’omic and phenotypic (e.g covariates). The genomic data are analyzed using GWASTools and GENESIS that are designed to perform quality control (QC) and GWAS using GDS infrastructure.
Next, we describe how both approaches are implemented:
- Pooled approach: Figure 13.2 illustrate how this analysis is performed. This corresponds to generalized linear models (glm) on data from single or multiple sources. It makes use of
ds.glm()function which is a DataSHIELD function that uses an approach that is mathematically equivalent to placing all individual-level data froma all sources in one central warehouse and analysing those data using the conventionalglm()function in R. The user can select one (or multiple) features (i.e., genes, transcripts, CpGs, SNPs, …)
Figure 13.2: Non-disclosive omic data analysis with DataSHIELD and Bioconductor. The figure illustrates how to perform single pooled omic data analysis. The analyses are performed by using a generalized linear model (glm) on data from one or multiple sources. It makes use of ds.glm(), a DataSHIELD function, that uses an approach that is mathematically equivalent to placing all individual-level data from all sources in one central warehouse and analysing those data using the conventional glm() function in R.
- Meta-analysis: Figure 13.3 illustrate how this analysis is performed. This corresponds to performing a genome-wide analysis at each location using functions that are specifically design for that purpose and that are scalable. Then the results from each location can be meta-analyzed using methods that meta-analyze either effect sizes or p-values.
Figure 13.3: Non-disclosive omic data analysis with DataSHIELD and Bioconductor. The figure illustrates how to perform anlyses at genome-wide level from one or multiple sources. It runs standard Bioconductor functions at each server independently to speed up the analyses and in the case of having multiple sources, results can be meta-analyzed uning standar R functions.