5 Biological interpretation of findings
In this chapter we will explain the steps for the biological interpretation of the findings. A file with the slides can be downloaded here
At the end of the practice, please answer these questions:
- Which is the top 1 enriched GO term in current smokers? and in former smokers?
- Which are the enriched Reactome pathways in current smokers? and in former smokers?
- Which are the enriched tissues in current smokers? and informer smokers?
We will need to load some libraries:
library(IlluminaHumanMethylation450kanno.ilmn12.hg19)
library(clusterProfiler)
library(org.Hs.eg.db)
library(enrichplot)
library(DOSE)
5.1 Load MetaEWAS results
We begin loading the Never vs Current FDR significant metaEWAS results
metaEWAS.FDRsig <- read.table(file = "./data/DAY5/Input/MA.Smoking.NeverVScurrent.FDRsig.txt",
                              sep=" ",
                              header = TRUE)
head(metaEWAS.FDRsig)
5.2 Annotation of CpG sites
Once we have obtained a list with the CpGs that are significant in our analysis, we need to locate them in the genome and try to know which structures surround them. The annotation consists in obtaining this information:
First we load the annotation from IlluminaHumanMethylation450kanno.ilmn12.hg19
R package and select the columns of interest
data("IlluminaHumanMethylation450kanno.ilmn12.hg19")
annotation.table<- getAnnotation(IlluminaHumanMethylation450kanno.ilmn12.hg19)
dim(annotation.table)
## [1] 485512 33
annotation.table<-as.data.frame(annotation.table[,c("chr","pos","strand",
                                                    "Name","Islands_Name",
                                                    "Relation_to_Island",
                                                    "UCSC_RefGene_Name",
                                                    "UCSC_RefGene_Group")])
head(annotation.table)
Merge our significant metaEWAS results with the annotation.
metaEWAS.ann<-merge(metaEWAS.FDRsig, annotation.table,by.x="probe",by.y="Name")
metaEWAS.ann.ord<-metaEWAS.ann[order(metaEWAS.ann$p.fe),]

head(metaEWAS.ann.ord)
Create list of Genes for Enrichment and save list of FDR CpGs and FDR genes
5.3 Functional enrichment analysis
The idea is to compare the list of genes that overlap our CpGs with the list of all the human genes that are anotated in specific databases. With this, we can see if our list of genes is a random subset or no.
First of all we convert Gene Symbols to Ensembl and Entrez Gene IDs to use them later
ids <- bitr(ann.genes.current, fromType="SYMBOL", toType=c("ENSEMBL", "ENTREZID"), OrgDb="org.Hs.eg.db")
head(ids)
5.3.1 GO
We will first work with the Gene Ontology (GO) database, that allows us to see if a specific gene function is overrepresented in our gene list. We need to obtain the list of all human genes that are curated in GO.
df = as.data.frame(org.Hs.egGO)
go_gene_list = unique(sort(df$gene_id))
And then run the analyses and keep the most interesting results.
ans.go <- enrichGO(gene = ids$ENTREZID,
                   ont = "BP",
                   OrgDb ="org.Hs.eg.db",
                   universe = go_gene_list,
                   readable=TRUE,
                   pvalueCutoff = 0.05)

tab.go <- as.data.frame(ans.go)
tab.go<- subset(tab.go, Count>5)
head(tab.go)
Finally we can perform different type of plots to see the results in a graphical way
p1 <- barplot(ans.go, showCategory=10) +
  ggtitle('Never vs Current Smokers') +
  theme(plot.title = element_text(size = 18))
p1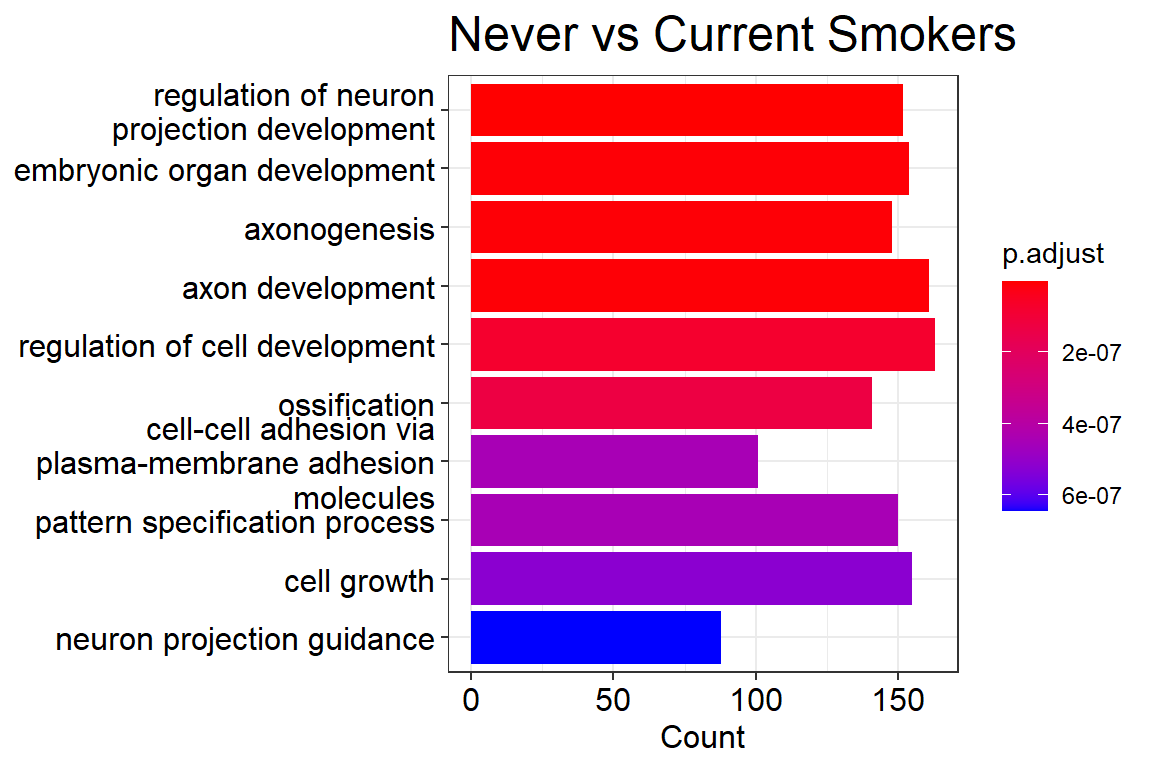
ans.go <- pairwise_termsim(ans.go)
p2 <- emapplot(ans.go, cex_label_category = 0.5, showCategory = 20) +
  ggtitle('Never vs Current Smokers') +
  theme(plot.title = element_text(size = 18))
p2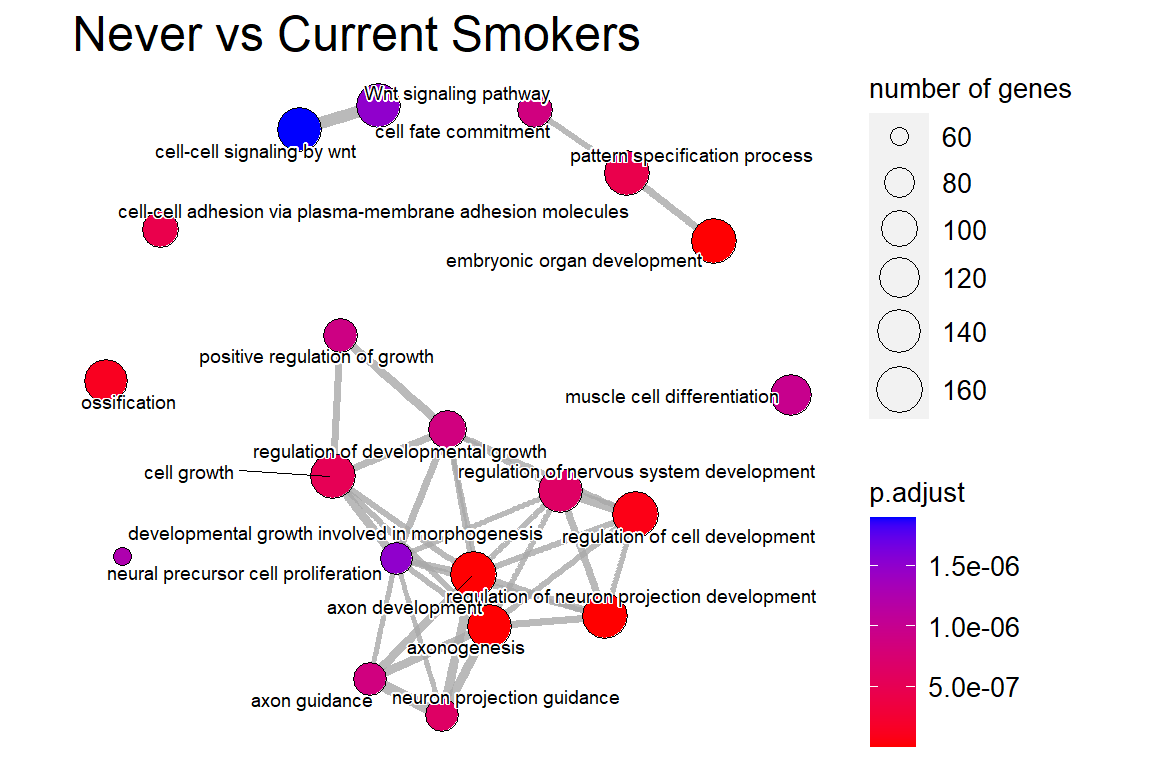
p3 <- cnetplot(ans.go, circular = FALSE, colorEdge = TRUE, showCategory = 2)
p3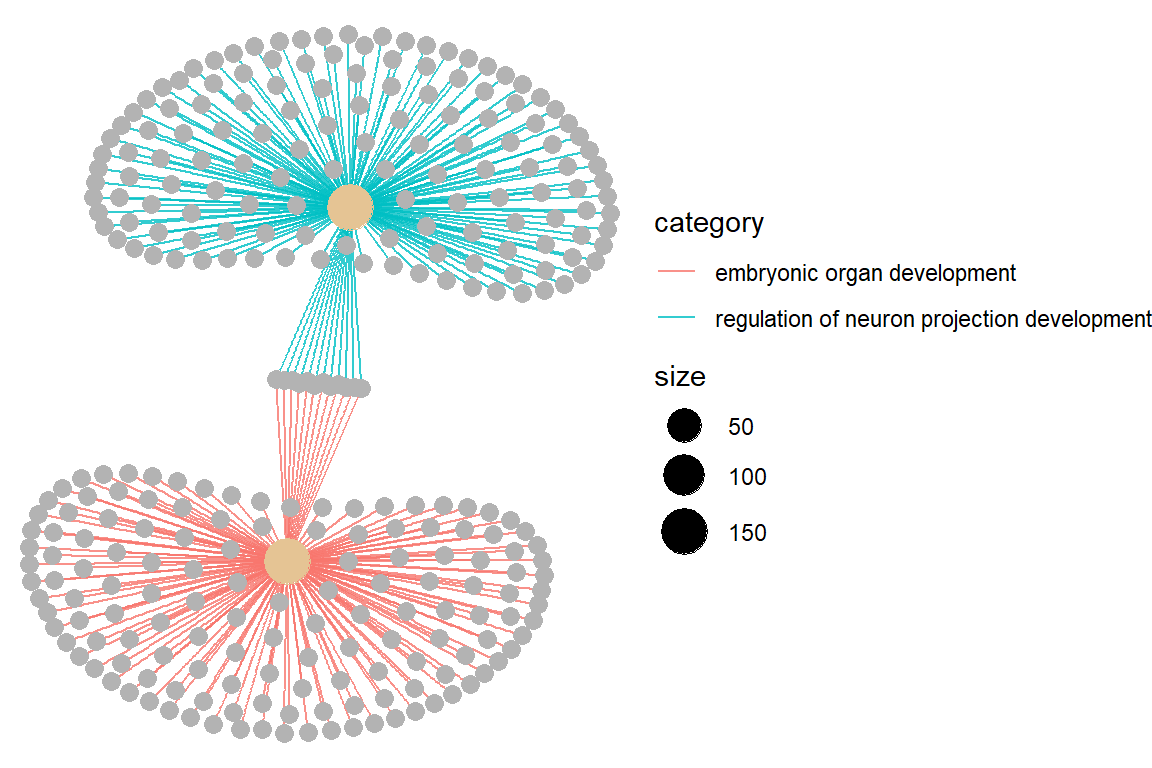
5.3.2 Reactome
Now we do the same for the Reactome database
ans.react <- enrichPathway(gene=ids$ENTREZID,
                           pvalueCutoff = 0.05,
                           readable=TRUE)
tab.react <- as.data.frame(ans.react)
head(tab.react)
In this case, it exists a function that allows us to graphically investigate each of the pathwaysto see how the genes interact between them. We need to prepare a named list with the entrez gene ids and their fold change
ids_coef_df <- merge(ids, metaEWAS.ann.ord[,c('UCSC_RefGene_Name', 'coef.fe')],
by.x = 'SYMBOL',
by.y='UCSC_RefGene_Name')
pathway_genes <- str_split(tab.react$geneID[[1]], '/')[[1]]
ids_coef_df <- ids_coef_df[ids_coef_df$SYMBOL %in% pathway_genes,]
ids_coef_df <- ids_coef_df[!duplicated(ids_coef_df$ENTREZID),]
ids_coef <- ids_coef_df$coef.fe
names(ids_coef) <- ids_coef_df$ENTREZID
p3 <- viewPathway("Platelet activation, signaling and aggregation",
readable = TRUE,
foldChange = ids_coef)
p3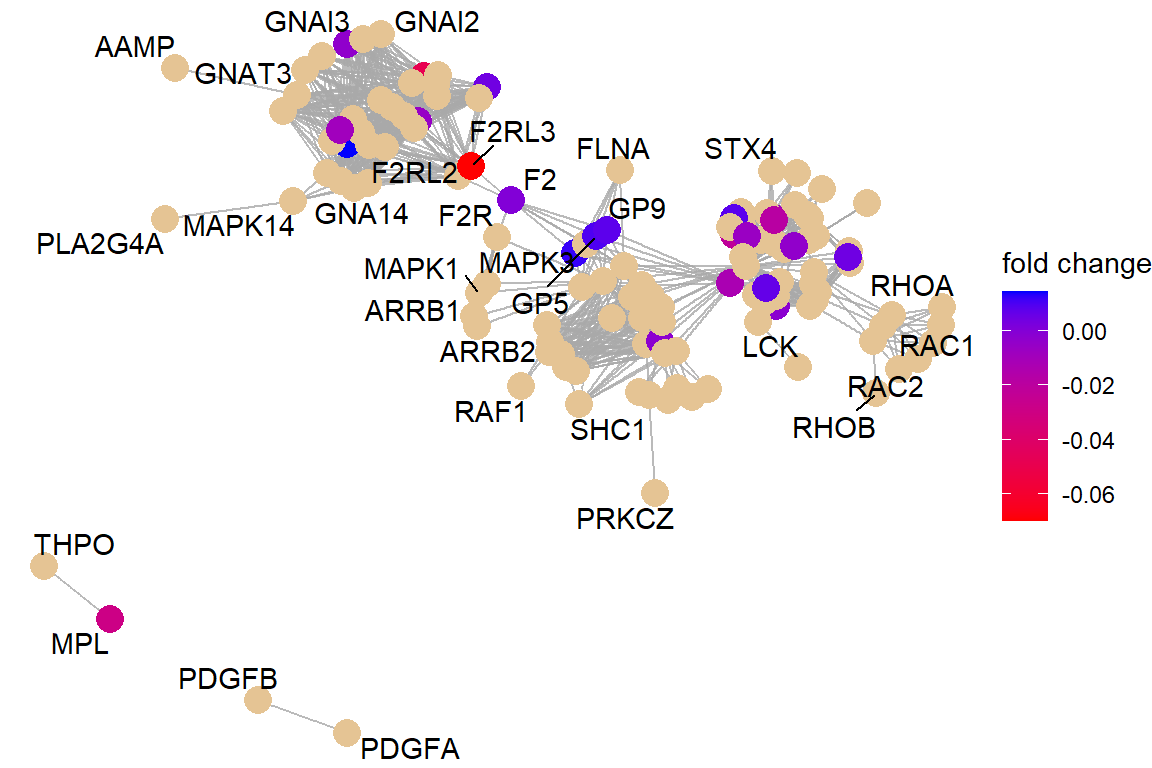 If the net is too busy, we can re-plot keeping just the genes on our list (the coloured ones)
p3$data <- p3$data[!is.na(p3$data$color),]
p3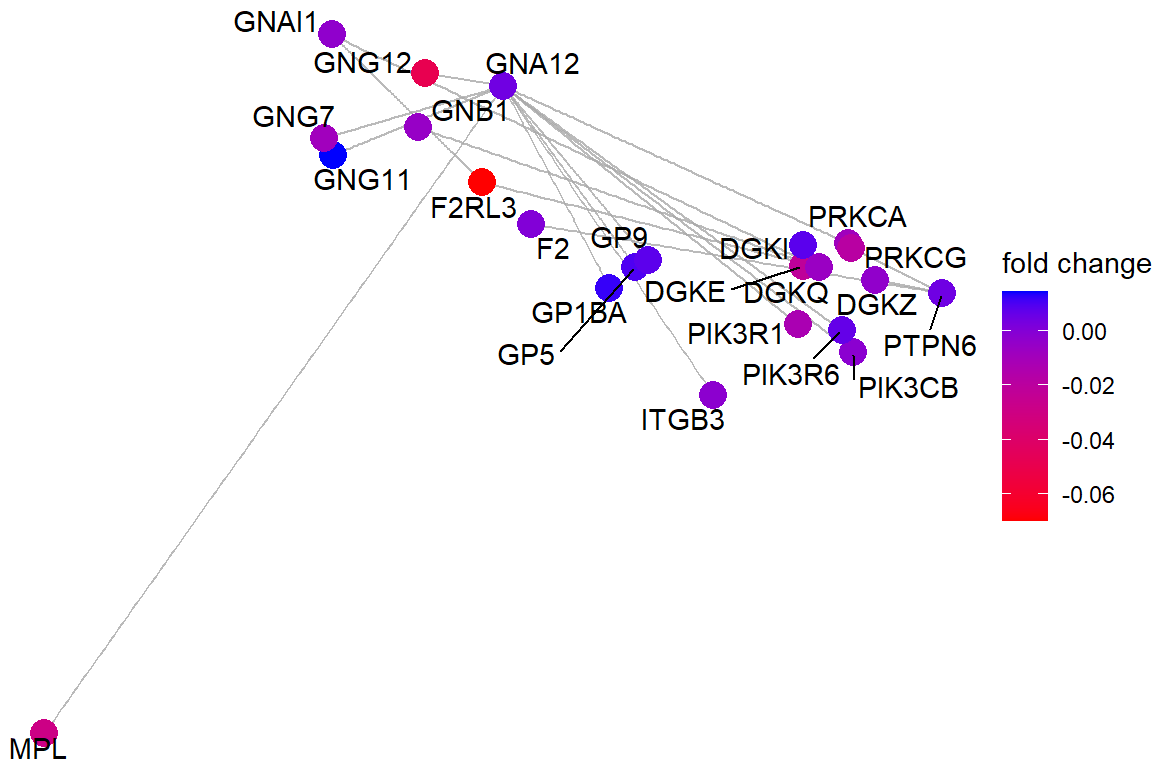
5.3.4 Online Tools
The functional enrichment can also be done online with some interesting tools:
eFORGE is used to identify cell-type or tissue-type specific signals in epigenomic data by looking at the overlap between differentially methylated positions (DMPs) with DNase I hypersensitive sites (DHSs)
EWAS Catalog is a huge database of EWAS results. We can submit the names of our top CpGs to see the last published information about them
ANSWERS
- For current smokers it is the regulation of neuron projection development. For former smokers it is embryonic organ development
- For current smokers it is Platelet activation, signaling and aggregation. For former smokers it is Neuronal System
- In current smokers they are blood and muscle. In former smokers they are blood and ESC
