LifeTwin Graph Representation Module
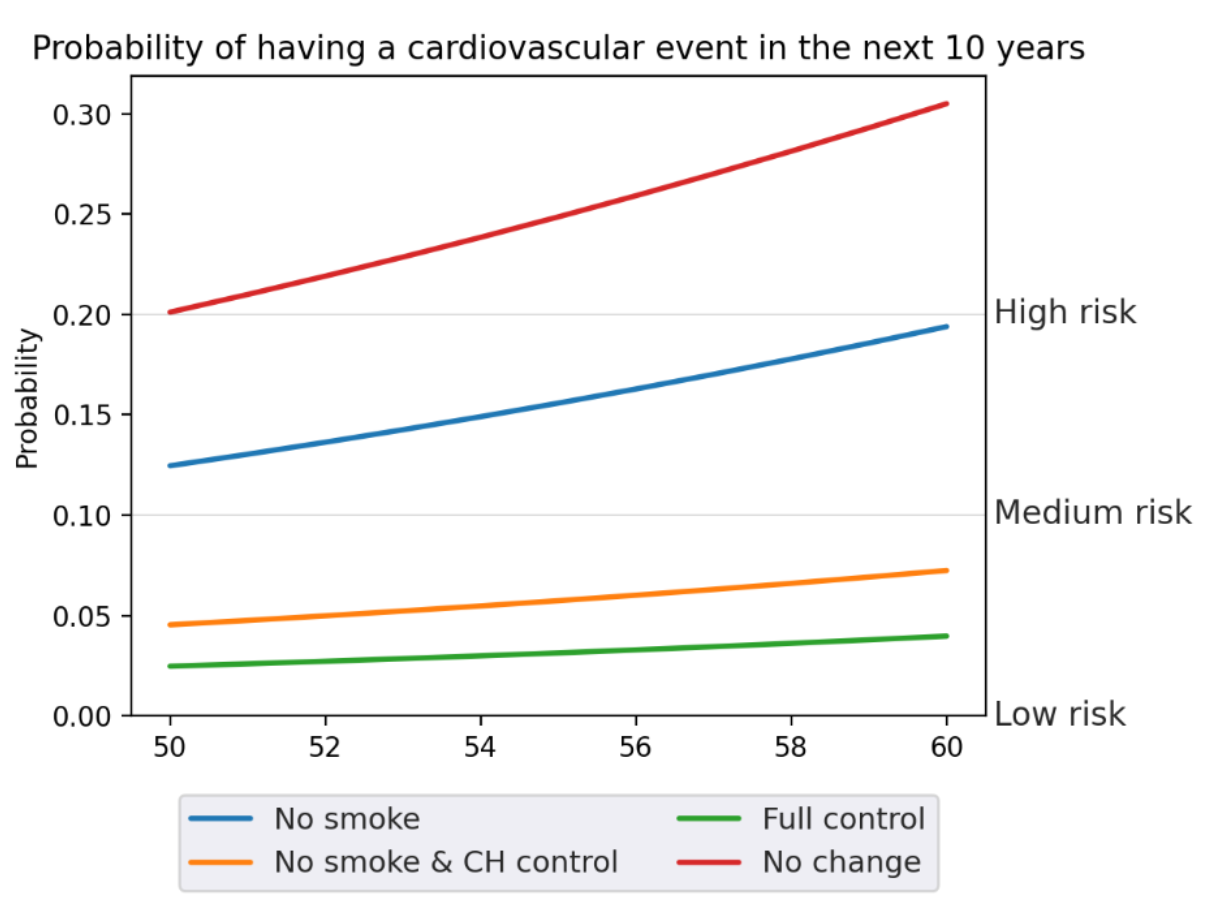
Single Prediction Example Graph
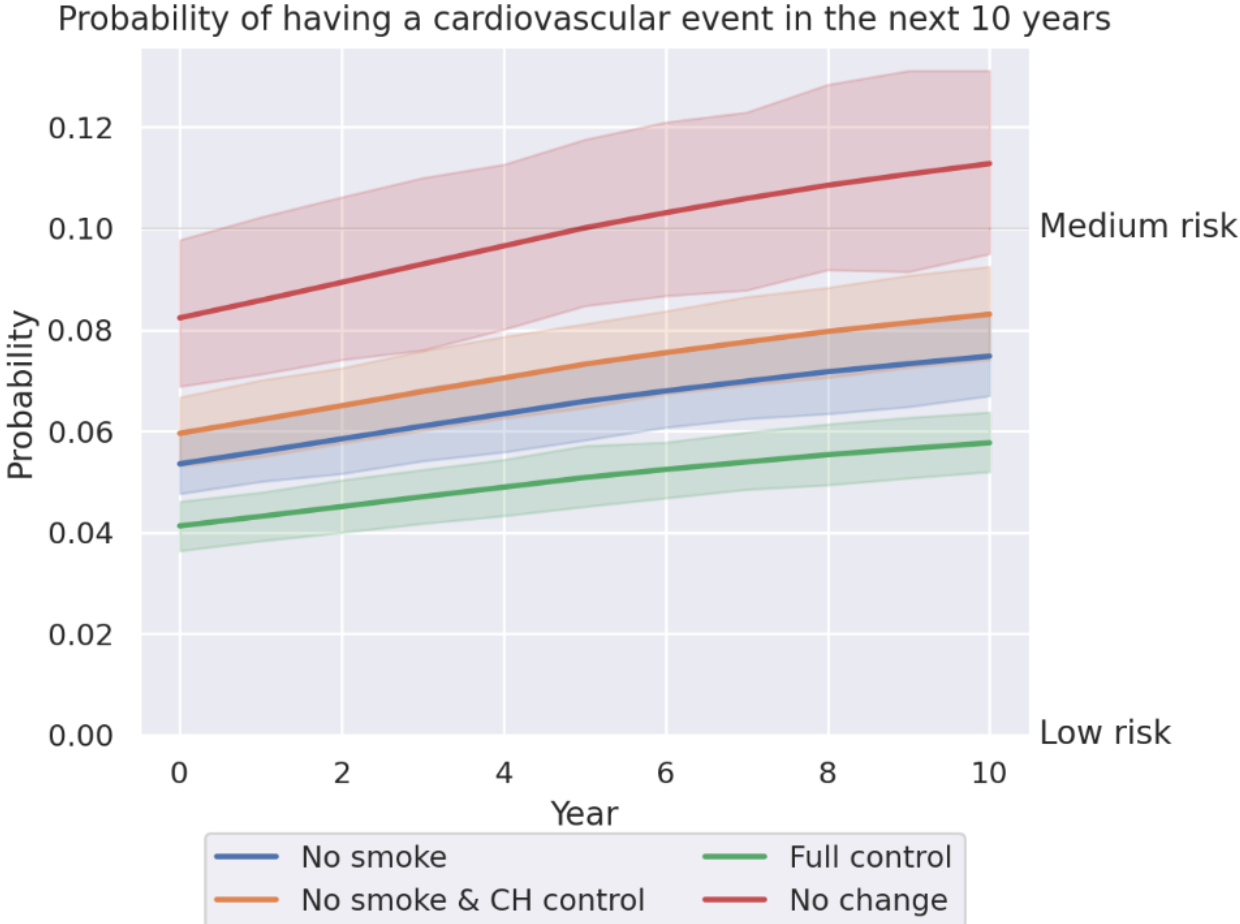
Spread Prediction Example Graph
Module Contents
A class to handle prediction and visualization of data changes.
- class graph.AbstractPrediction
Bases:
objectA class to handle prediction and visualization of data changes.
- plot_change(ax=None)
Plot the change in the data.
- Args:
ax (matplotlib.axes.Axes, optional): The axes to plot on. If not provided, a new figure will be created.
- Returns:
None
- show_change()
Show the change in the data.
- class graph.Prediction(current_age: int, prediction_years: int, labels: list, predictions: list, model: BioModel, return_category: ReturnCategory)
Bases:
AbstractPredictionA class to handle predictions and visualize the data changes using line plots for continuous data and tables for categorical data.
- current_age: int
- labels: list
- plot_change(ax=None)
Plot the change in the data using line plots for continuous data and table for categorical data.
- Args:
self (Prediction): An instance of the Prediction class. ax (matplotlib.axes.Axes, optional): The axes to plot on. If not provided, a new figure will be created.
- Returns:
matplotlib.axes.Axes: The axes containing the plotted data.
- prediction_years: int
- predictions: list
- return_category: ReturnCategory
- show_change()
Show the change in the data using the plot_change method and display the plot.
- Args:
self (Prediction): An instance of the Prediction class.
- Returns:
None
- class graph.SinglePrediction(labels: list, predictions: list, model: BioModel, return_category: ReturnCategory)
Bases:
AbstractPredictionA class to handle single predictions and visualize the data changes using bar plots or tables.
- labels: list
- plot_change(ax=None)
Plot the change in the data using bar plots.
- Args:
self (Prediction): An instance of the Prediction class. ax (matplotlib.axes.Axes, optional): The axes to plot on. If not provided, a new figure will be created.
- Returns:
matplotlib.axes.Axes: The axes containing the plotted data.
- predictions: list
- return_category: ReturnCategory
- class graph.SpreadPrediction(prediction_years: int, tables: dict[str, DataFrame], model: BioModel, return_category: ReturnCategory)
Bases:
AbstractPredictionA class to handle spread predictions and visualize the data changes using line plots for continuous data.
- plot_change(ax=None)
Plot the change in the data using line plots for continuous data.
- Args:
self (SpreadPrediction): An instance of the SpreadPrediction class. ax (matplotlib.axes.Axes, optional): The axes to plot on. If not provided, a new figure will be created.
- Raises:
ValueError: If attempting to plot categorical predictions for a population.
- Returns:
matplotlib.axes.Axes: The axes containing the plotted data.
- prediction_years: int
- return_category: ReturnCategory
- show_change()
Show the change in the data using the plot_change method and display the plot.
- Args:
self (SpreadPrediction): An instance of the SpreadPrediction class.
- Returns:
None
- tables: dict[str, DataFrame]
- graph.calc_global_95CI(dfs: list[DataFrame])
Calculate the 95% confidence interval for the global mean based on the provided list of pandas DataFrames.
- Args:
dfs (list[pd.DataFrame]): A list of pandas DataFrames containing the data.
- Returns:
tuple: A tuple containing the minimum and maximum values of the 95% confidence interval for the global mean.
- graph.integrate_horizontals(self, ax, min_interval, max_interval)
Integrate horizontal lines representing intervals into the plot.
- Args:
self: The instance of the class. ax (matplotlib.axes.Axes): The axes to integrate the horizontal lines into. min_interval (float): The minimum value of the interval. max_interval (float): The maximum value of the interval.
- Returns:
None
- graph.set_minimum_value(ax, minimum, meaning, model)
Set the minimum value for the y-axis on the plot based on the meaning and model intervals.
- Args:
ax (matplotlib.axes.Axes): The axes to set the minimum value for. minimum (float): The minimum value. meaning (str): The meaning of the data. model: The model used for the prediction.
- Returns:
float: The adjusted minimum value for the y-axis.